Medical Information Simulation (MIS)
A web app for teaching laboratory quality control. Faculty set up QC lots with target values. Students run QC, enter results and read their own Levey-Jennings charts with Westgard rule checks, then faculty grade each run. It began as a team capstone for Texas Tech University Health Sciences Center. I later finished the core workflow end to end. It is an educational simulation, not for clinical use, and all data is synthetic.
React 18, TypeScript, MUI, Recharts, Vite, ASP.NET Core 8, EF Core, ASP.NET Identity + JWT, SQL Server, Docker, Playwright, GitHub Actions, Firebase Hosting
The problem
- Clinical lab science students learn quality control by running control samples, judging whether each run is in control, and documenting what they did. The team set out to simulate that loop in a browser: faculty define control lots, students run and record QC, and faculty review the work.
- When I came back to it, the project had a working skeleton but not a working product. Sign-in downloaded every user record and compared password hashes in the browser. Sign-up let a caller give themselves the faculty role. The JWT signing key was committed. Student submissions lived only in browser storage, and the review page plotted hard-coded sample data.
Constraints
- Keep the team’s stack (React + ASP.NET Core) and its domain model, so the project stays recognizably theirs.
- Every page in the navigation must work against persisted data, or come out of the navigation.
- Standard QC definitions only: z-scores against the lot’s mean and SD, Levey-Jennings limits at ±1/2/3 SD, and Westgard rules.
- No paid hosting, and no real student or patient data.
What I built
Every page talks to one typed API interface. The normal build sends it over HTTP to the ASP.NET Core API. The demo build swaps in an in-browser implementation with the same workflow rules over synthetic data, so the live demo is free static hosting.
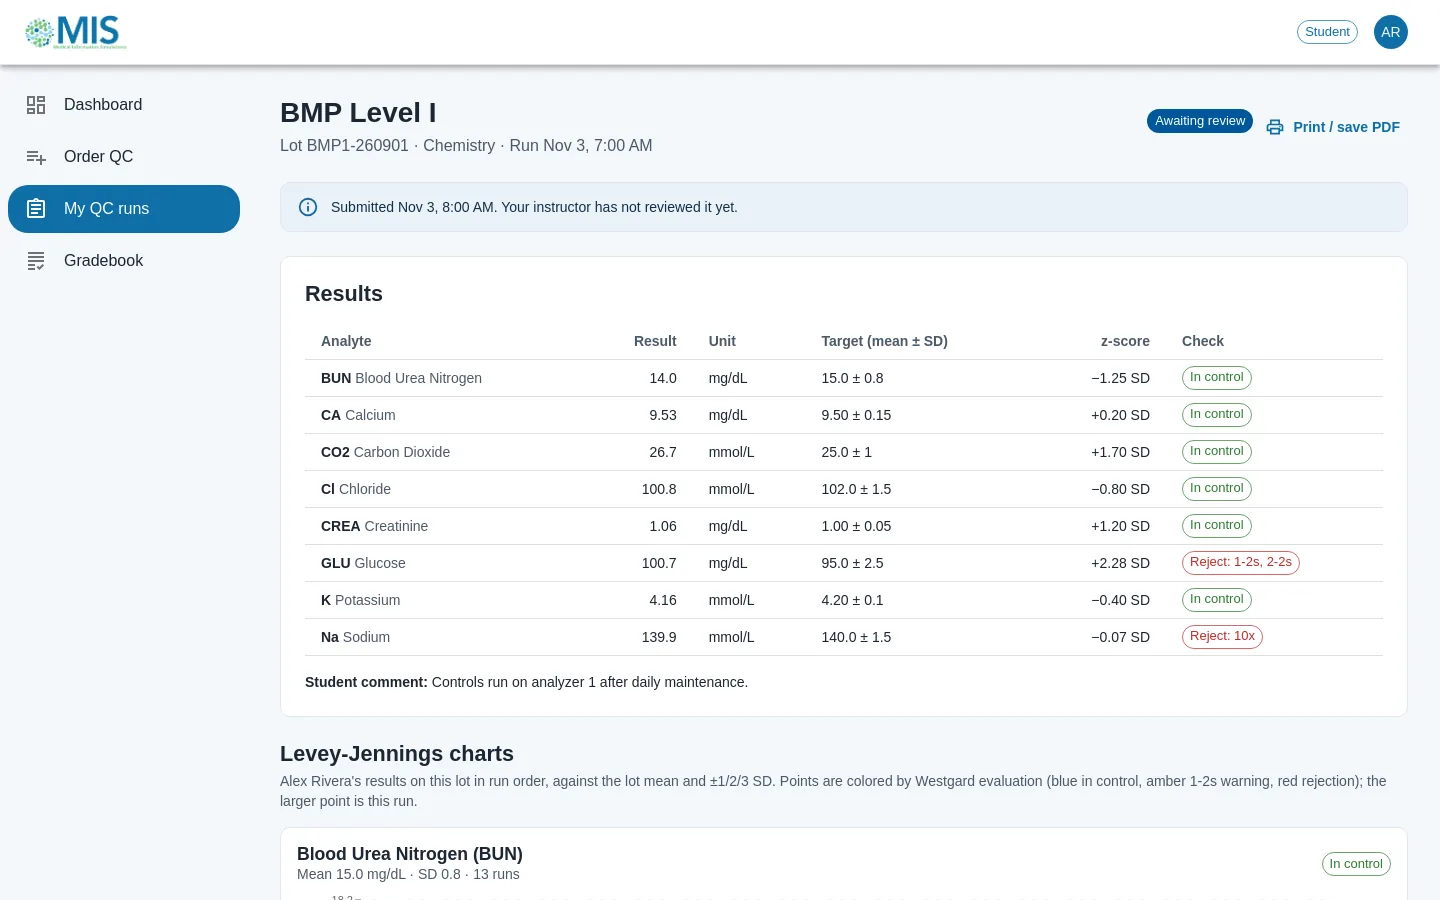
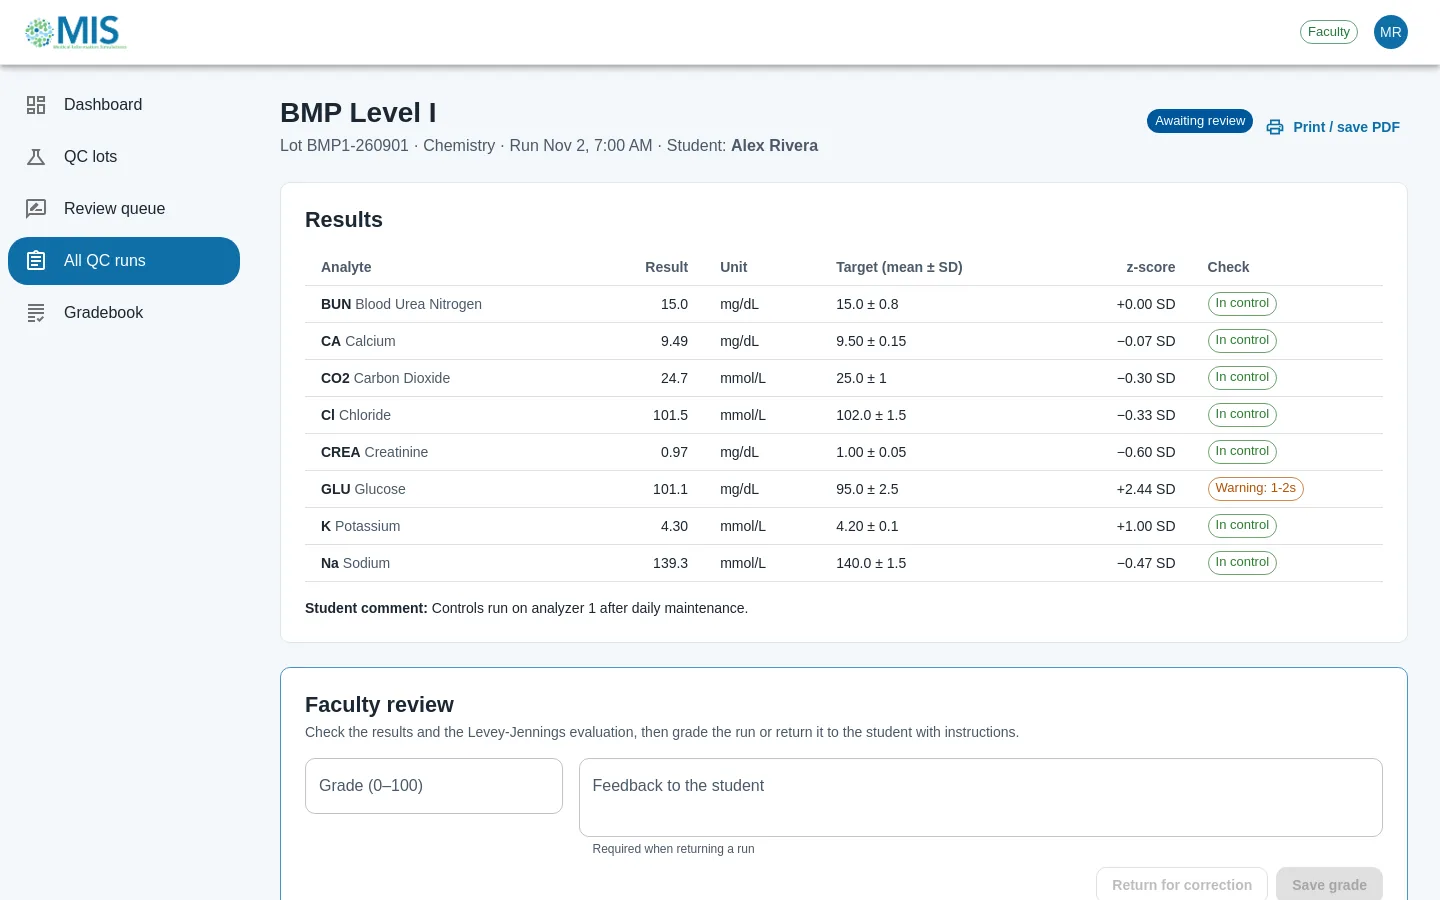
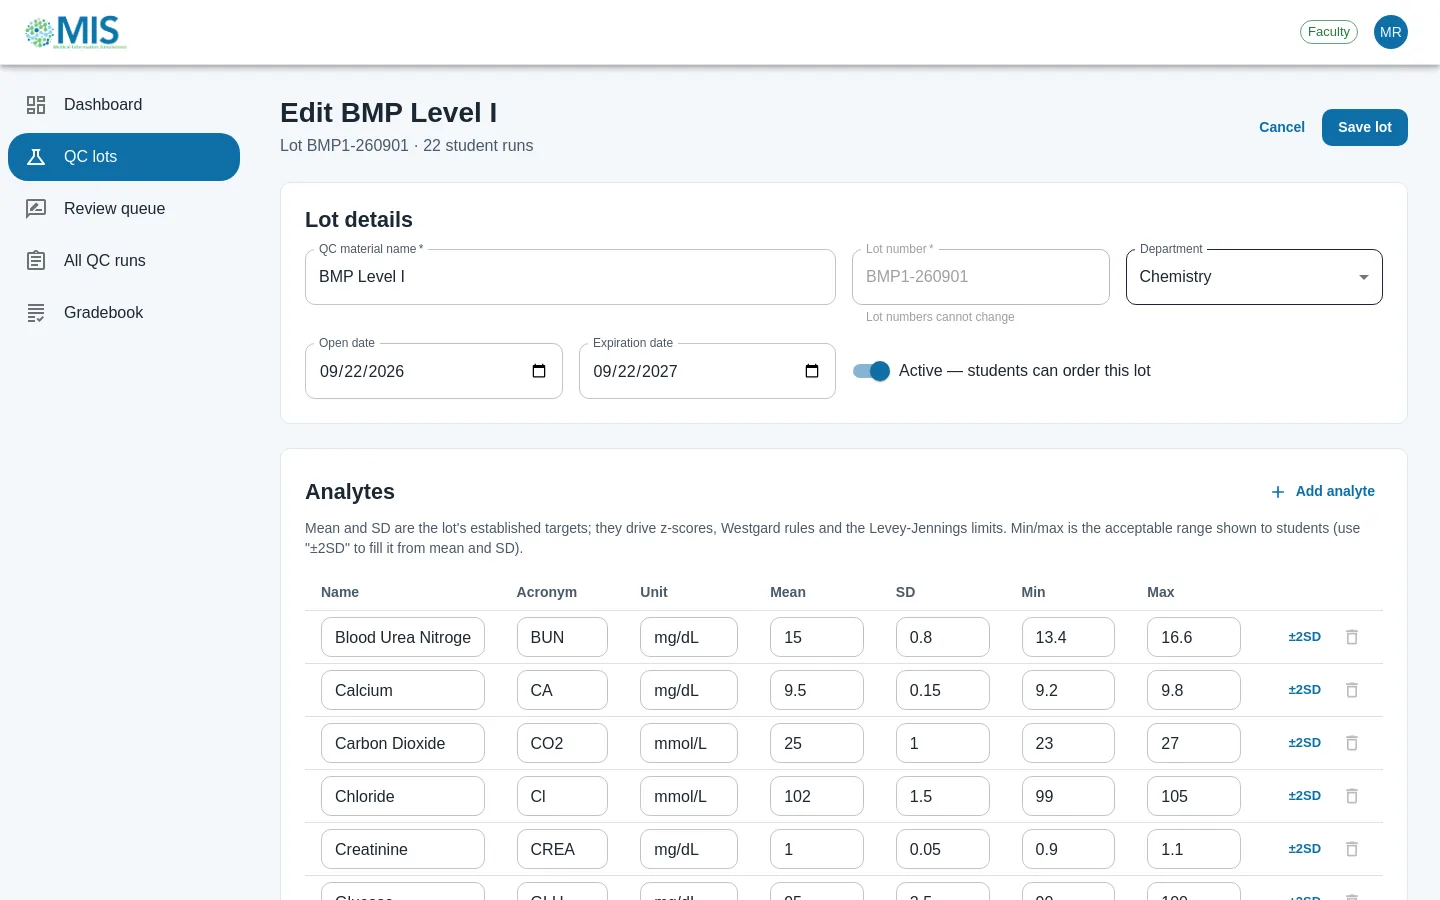
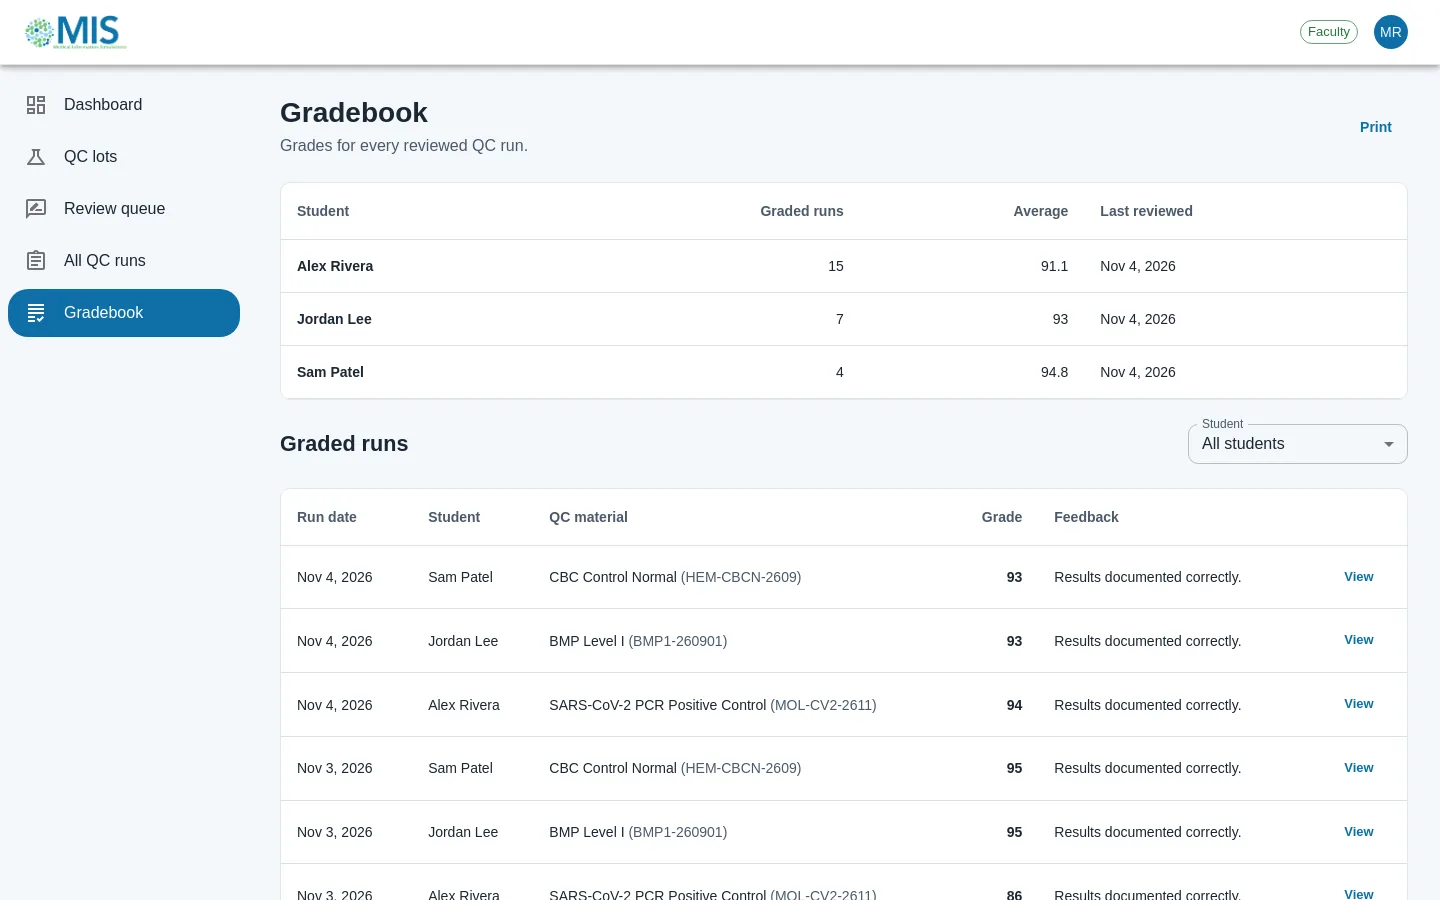
- The full loop: faculty create and edit QC lots and analytes; students order a run, enter results with live z-scores, and submit; faculty grade it or return it for correction; grades land in a gradebook for both roles.
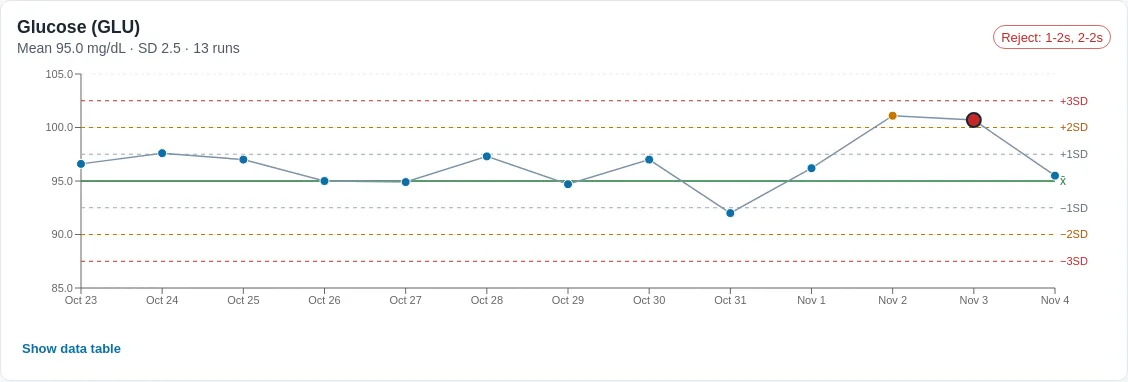
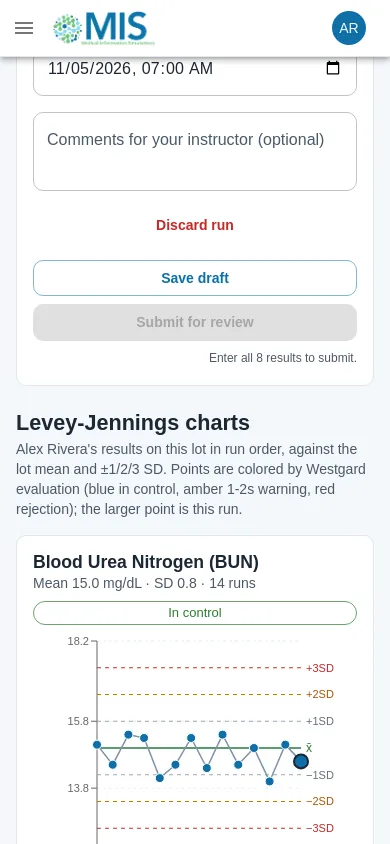
- Levey-Jennings charts for every analyte, with points colored by Westgard result (1-2s, 1-3s, 2-2s, R-4s, 4-1s, 10x), plus a data table for keyboard and screen-reader users.
- Server-side authentication with roles: deny-by-default authorization, sign-up that can only create students, per-account lockout and a per-IP rate limit on sign-in. A student asking for another student’s run gets a 404.
- The run lifecycle (in progress → submitted → graded, or returned → resubmitted) as a small pure state machine, so each rule is a one-line unit test.
- Local setup with no shared secrets: a script generates the database password and JWT key, and the API refuses to start without a strong key. One Docker Compose command runs the whole stack.
Screenshots
Decisions and trade-offs
- I kept the team’s stack and domain names rather than rewriting in something newer. The point was to finish their product, and I can explain every layer.
- I removed quizzes, case studies and patient reports from the navigation instead of shipping them half-built. They had no backend, and a finished QC loop was worth more.
- Westgard rules run in the client as pure functions, because a rejection informs the student and the grader but doesn’t block anything. If it ever gates submission, the rules move to the server.
- Each result is judged against earlier runs only, the way a tech applies the rules at the bench. The results table and the chart share one evaluation, after I found them disagreeing (a warning in one, a 2-2s rejection in the other).
- All timestamps are UTC end to end. Screenshots showed a run created at 5:08 PM appearing as 9:08 AM the next day: the database returned dates with no time zone, and every save shifted them by eight hours. One EF Core convention and a regression test fixed it.
Results
- The core workflow works end to end on SQL Server, and the live demo runs it entirely in the browser.
- 34 API tests, 41 client unit tests and 8 Playwright end-to-end tests, including an axe WCAG 2.1 AA scan of every page and a keyboard-only walkthrough. GitHub Actions runs them on every push, plus a job that builds and smoke-tests the Docker stack.
- TypeScript errors went from 107 to 0. Tracked files went from 794 to 172 after removing snapshots, a 75 MB zip and committed build output (all still in git history).
- The accessibility scan found real issues that I fixed: low-contrast status colors, and hidden table headers that made every table page 774 px wide on a 375 px phone.
- Initial JavaScript went from 289 kB to 179 kB gzipped after lazy-loading the chart page.
What I'd do next
- Version lot targets, so that correcting a mean or SD doesn’t re-score past runs (the editor warns about this today).
- Bring back quizzes and case studies on the same pattern (API endpoint, typed client method, demo implementation).
- Password reset, and hosting for the real API.
Team and credit
- Team capstone at Texas Tech University Health Sciences Center (2024). Huy (the original repository’s owner) built the original client and API, including the QC builder. Geethika built the first Levey-Jennings chart. Taylor Smith built QC creation, sign-up and login against the database. Jaden Haagen built the account page and password hashing. Cristian Cuomo built the quiz and submission pages.
- My 2024 work: rebuilt the client, consolidated the API from Huy’s code, built the QC order and report flow, and did the first Firebase deploy.
- Finishing the project (the finish-mis branch) was an exercise in agentic development with Claude Code. I set the brief, the constraints and the priorities. Claude wrote most of the code, and every decision and its reasoning is documented in the repository.